1) Gooberment needs to "trim" it's higher echelon manglement first...before turning to the lower, worker-bee, peons who are actually DOING the work.
2) Gooberment needs to eliminate their "Peter Principle" of promoting dunces as punishment...and lateral or demote them!
3) Gooberment needs to remember THEY work for US, not the otherway around!
4) NOAA/NWS needs to beware of the possibility of BIG gooberment treating them as they did USPO by spinning them off to fend for themselves!
Some "top heaviness" evidence:
I'll not address the first three points listed, they're too general and more common to almost any large org.
Point 4 is a difficult one. As a quasi-independent business (and before) I think that that USPS performs somewhat better, for me certainly*, than it's competitors FedEx and UPS.
And the USPS works with a very considerable handicap(s), imposed for mostly political ideological reasons: The USPS is forced to pay into it's workforce's pension plans at much higher rates (amortization) than has ever been required or done before. This excessive annual expense cost has hindered their doing even better than they do now.
How is USPS better?
Point A: Their competitors try to utilize the "last mile" service of the Post Office every chance they get, having (recently) formed agreements to contract this with USPS (FedEx's "SmartPost", UPS's "MailInnovations & ?Post").
* Point B: At least for me, in a rural area, USPS has a much better delivery success rate. The other two leave my packages somewhere other than my place a third or more of the times. And UPS has damaged stuff before multiple times, once a valuable, rare, naval print (in wood frame, under glass, broken, carelessly dropped on a corner (it was well packed)).
Now the big thing:
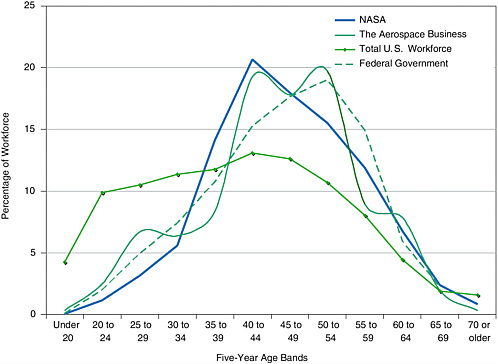
That graph. IMO, it is both misleading, and practically meaningless.
Absolutely not the "evidence" you think it is.It simply depicts an organization, NOAA (and also aerospace & gov), that you would naturally
expect to represent a slightly older, far more educated, workforce/staff, than the general average of all American workers, which is of course the younger, lower percentage number of, lower tracing line on the graph.
The graph doesn't show 'top-heaviness' or even 'excessive supv/mgmt' to me, just the fact that the average education level of the highly-skilled (for the most part, I think we can agree) workers at NOAA is higher than average general population workers (probably much more so); and therefore they're naturally a little older, having been in schools longer (and perhaps working their trade or interning beforehand too).
I think you'll find a similar comparison of, say, MD's (doctors) versus the general pop, to appear/skew in exactly the same way on a graph. Remember that old Mark Twain(?) quip about "statistics" (sorry, but ATT I can't remember it quote it

).


