Good evening people,
After a few weeks of tweaking and playing with it, I've decided to release the Weather Graphs script on WXforum.net as well. It's been on Weather-Watch for almost a month, without any complains so far.
What does it do? It basically uses the Weather Display CSV logfiles, to produce some good looking graphs for your webpage. Since this is a standalone script, you can import it in any website setup.
What kind of graphs does it produce? In the latest version, the script plots Temperature, Dewpoint & Heat Index (on the same graph), Rain, Solar Power (for those who enable the feature), Humidity, Barometer, Wind Speed, Gust Speed and last but not least Wind direction graphs.
Demo - Screenshots There is a
live demo, on my personal website, so check it out to watch the script in action.
Additionally I am posting a couple of screenshots
Temperature graph:

Solar power graph:

Wind Speed graph:

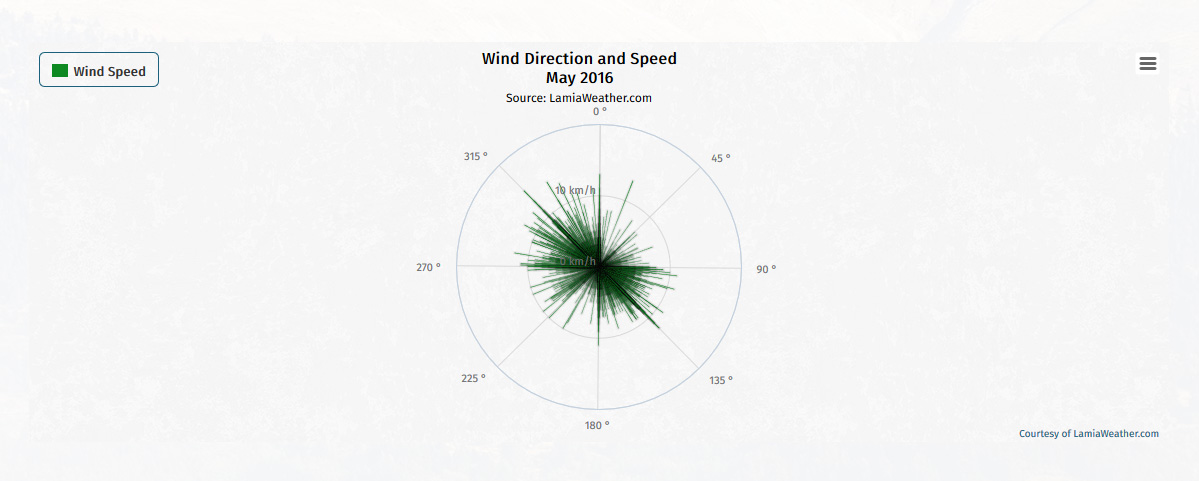
Wind Direction graph:
 All good, where is the script?
The script is located on
GitHub, and it comes with a wiki page, which you should read before using it.
I will update this script from time to time and I will try to help you out guys with any problems that you come across, but be patient


